AEC Technology Updates Straight to Your Inbox
Thank you! Your submission has been received!
Oops! Something went wrong while submitting the form.
By subscribing, you agree to our Privacy Policy and consent to receive updates from our company.


.webp)
.svg)


October 16, 2026

3:14 pm
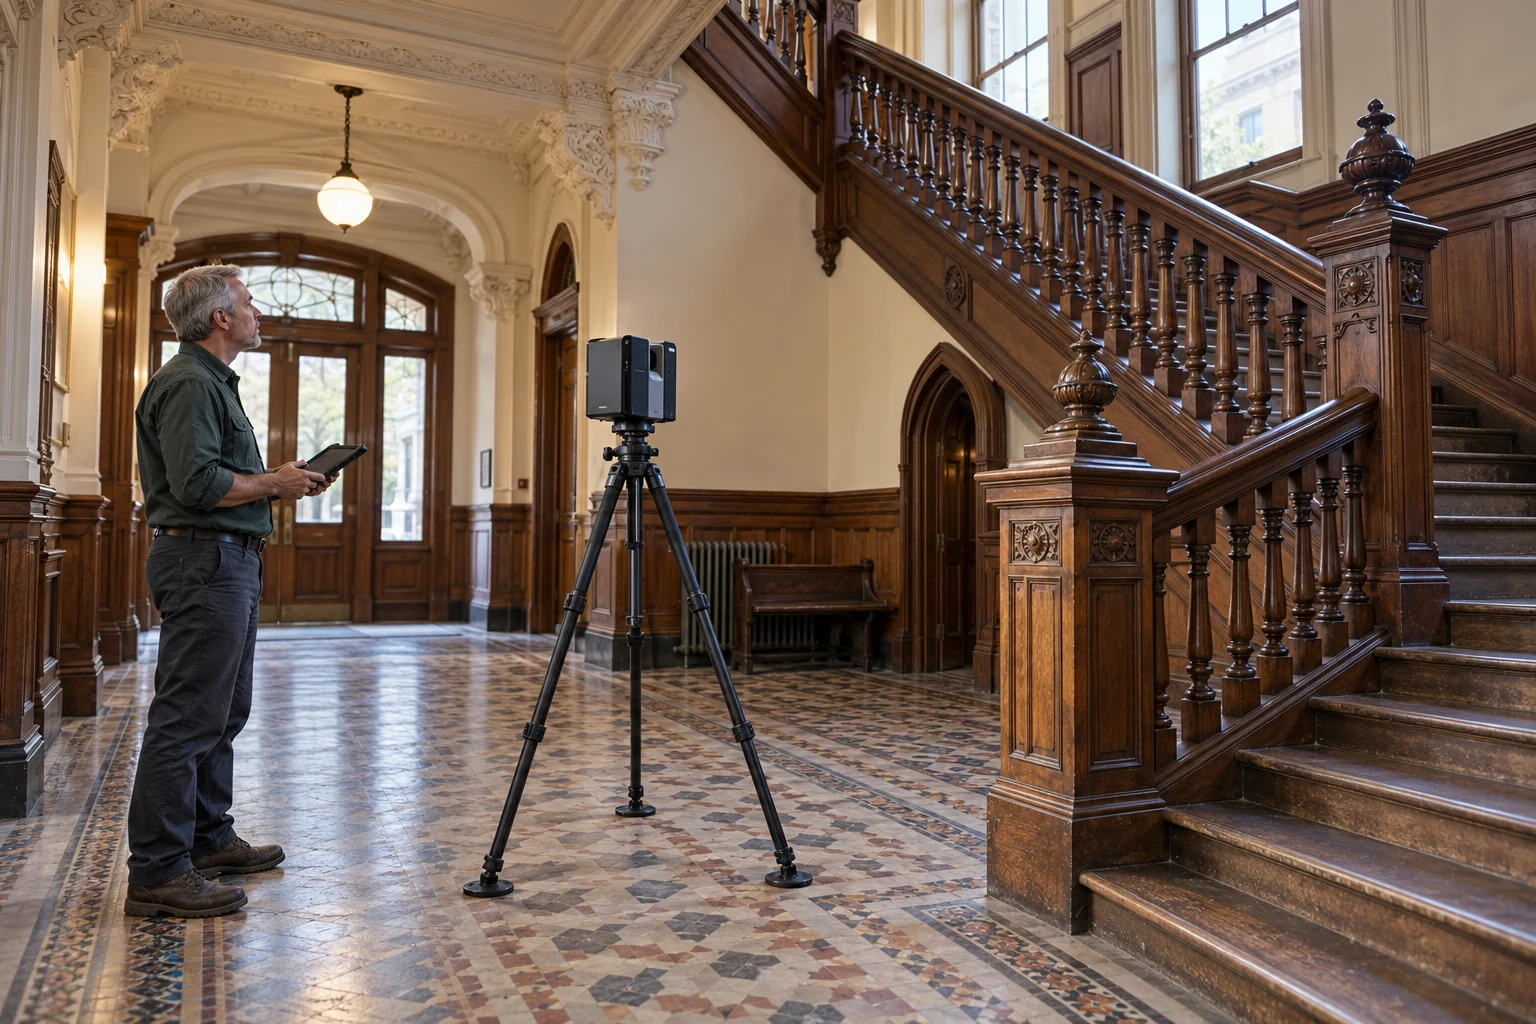
GIS mapping helps assess construction flood risk in San Francisco by layering FEMA flood zones, SFPUC 100-year storm data, and sea level rise projections over accurate site elevations. GIS flood risk mapping combined with RTK drone and GPS survey data from GIS mapping services gives designers and civil engineers a defensible basis for site selection, finished floor elevations, and drainage planning, supported by civil engineering production support.
GIS flood risk mapping is the process of overlaying official flood hazard data, terrain models, and site survey information in a geographic information system so project teams can see where water is likely to collect and how deep it may get. For construction, the value lies in combining regulatory layers, such as FEMA Special Flood Hazard Areas, with project-specific elevations captured on site. A digital elevation model (DEM) built from drone imagery or GPS points shows low spots, overland flow paths, and grade breaks that regional maps cannot resolve at parcel scale. Analysts can then add storm drain locations, groundwater observations, and projected sea levels as separate layers. The result is not an engineering design. It is a shared spatial picture that helps owners, architects, and civil engineers ask better questions before committing to a footprint or building pad elevation.
Three map sets matter most in San Francisco: the FEMA Flood Insurance Rate Map, the SFPUC 100-Year Storm Flood Risk Map, and the City's Sea Level Rise Vulnerability Zone. The current FEMA FIRM for San Francisco took effect in March 2021 and shows coastal flood hazard zones along parts of the waterfront, Mission Bay, Islais Creek, Bayview Hunters Point, Treasure Island, and Ocean Beach. The SFPUC map is different because it shows parcels likely to experience deep, contiguous flooding from stormwater runoff during a 100-year storm, not flooding from the Bay or ocean. The Sea Level Rise Vulnerability Zone reflects an upper-range end-of-century scenario and is used to identify City capital projects that must follow sea level rise planning guidance. Each map answers a different question, so a sound assessment reviews all three.
RTK drone and GPS surveys improve GIS flood risk mapping by replacing generalized regional terrain with precise, current elevations for the actual site. Regional DEMs are often too coarse to show a curb cut, a depressed loading dock, or a recently regraded lot, yet those features control where stormwater goes. Real-time kinematic (RTK) positioning ties drone imagery and ground shots to survey control, so the resulting surface can be compared directly with base flood elevations and storm flood elevations. Vertical datum handling deserves special attention in San Francisco. The SFPUC publishes flood elevations relative to San Francisco City Datum, which differs from NAVD88 by more than 11 feet, and the City has adopted its own NAVD88 realization, SFVD13. Mixing datums without conversion can make a site look safely above or dangerously below a flood elevation when neither is true.
Flood risk data informs where to build, how high to set floors, and what documentation reviewers expect during permitting. In San Francisco's Special Flood Hazard Areas, the Floodplain Management Ordinance requires the first floor of new or substantially improved residential buildings to sit above the Base Flood Elevation, while non-residential buildings must be elevated or floodproofed, with construction standards tied to the San Francisco Building Code and ASCE 24. City capital projects in the Sea Level Rise Vulnerability Zone above a cost threshold must complete a sea level rise checklist no later than 30 percent design. Private developers across California also use GIS layers during due diligence to compare candidate parcels, plan drainage, and anticipate groundwater conditions for below-grade levels. Licensed engineers make the final design decisions, but accurate mapping makes their work faster and better documented. See how this connects to GIS and BIM integration for infrastructure.
Plansrow provides GIS mapping and survey data capture for AEC teams evaluating flood exposure in San Francisco, with hubs in San Diego, Fresno, Austin, Baltimore, and Seattle supporting projects nationwide. Our remote field teams use RTK drones and GPS surveying to produce elevation surfaces, site features, and drainage context that integrate with ArcGIS, AutoCAD, and Civil 3D. That means your civil engineer can bring our data straight into grading and drainage design without rebuilding the base map. With more than 15 years of experience and a team of 30+ professionals, we support early due diligence, design development, and permit documentation. We provide data and mapping, not engineering certification, so your engineer of record stays in control of design decisions. To scope your site, request pricing through our instant online quote and tell us your parcel, schedule, and deliverable format.

By subscribing, you agree to our Privacy Policy and consent to receive updates from our company.
